Plot DVHs With OxyPlot
- May 7, 2018
- 6 min read
You may already be familiar with the plotting capabilities of other programming languages, such as MATLAB or R. It may then surprise you to learn that C# does not come with the ability to plot data out of the box. That is not to say that C# and the .NET Framework do not have any graphical capabilities. On the contrary, C# can be used to write sophisticated 2D and 3D graphical applications, including video games. But these capabilities are added to the language by the use of class libraries, which are collections of code that provide some specific functionality (see Share Your Code By Writing Class Libraries).
There are two main class libraries that allow you to plot data in C#: OxyPlot and LiveCharts. Both of these libraries are free and open-source under the MIT license, which means you can use them in commercial applications. They both support many kinds of plots and allow you to customize most aspects of their visualization. OxyPlot has been around since 2010. LiveCharts was started in 2015 by a developer who wanted to have a more "modern" look to his plots. Because OxyPlot is the more established library of the two, I will show you the basics on how to use it in this blog post. But the concepts you learn will allow you to easily pick up LiveCharts, if you desire.
I wrote the scripts in this post using ESAPI v. 13.6, but they should work with minimal modifications under ESAPI v. 15. I used Visual Studio Community 2017, which is freely available for download. Also, to easily test scripts within Visual Studio, I used the library EclipsePlugInRunner (see Run and Test Plug-In Scripts from Visual Studio). This library lets you run your script directly from Visual Studio, without having to open Eclipse every time you want to run it. You don’t need EclipsePlugInRunner to follow along, but it’ll make testing easier.
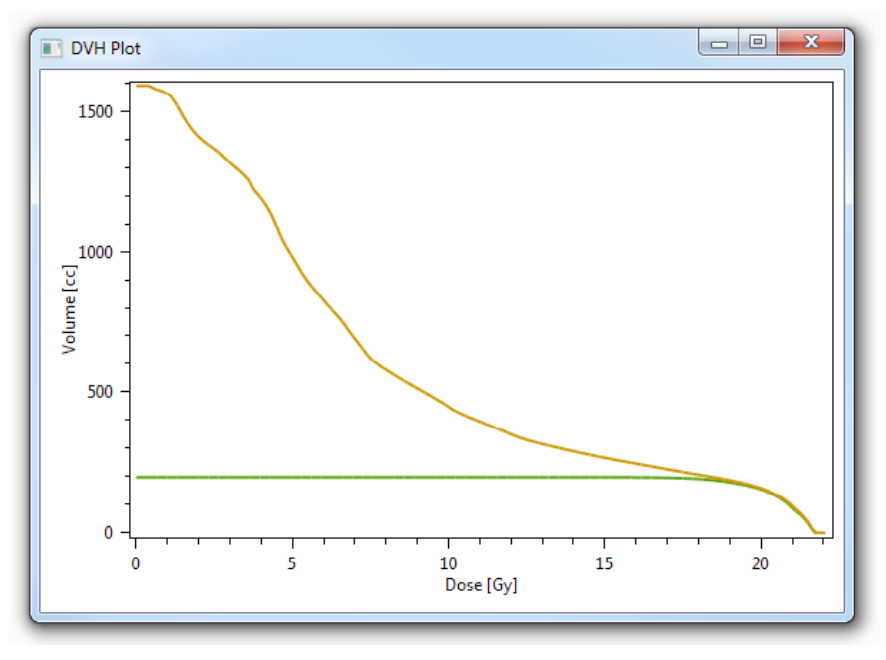
You’re going to write an ESAPI plug-in script that will plot the DVHs of specific structures in the opened plan. The plot will automatically allow the user to interact with it, such as displaying the individual data points when the plot is clicked. Here’s what your script will look like when it’s finished:
The source code for this script is in the DvhPlotWithOxyPlot repository on GitHub. It's the complete script, so it also contains the additions you'll see in future posts.
Start by creating a new Class Library (.NET Framework) project in Visual Studio to contain the binary plug-in script. Name the project "BasicDvhPlot.Script" and the solution "BasicDvhPlot".
Now rename the default class to Script, and add the references to ESAPI. Also, add references to PresentationFramework, PresentationCore, WindowsBase, and System.Xaml (you’ll need them to display a window). Finally, add a reference to the OxyPlot library. To do that, right-click on the References section of your project, and choose Manage NuGet Packages.
Click on the Browse tab in the main window and type "OxyPlot" in the search box. Find "OxyPlot.Wpf" in the results list, and click on it. On the right window, choose Version 1.0.0 and click on the Install button. You now have the OxyPlot class library reference by your project, which means you can use any of its functionality.
As you know, every ESAPI binary plug-in script must have an Execute method in its main class. The Execute method is called by Eclipse when your script is started. This method must declare a ScriptContext object as a parameter and an optional Window object. Add the Execute method to the Script class with the following code:
public void Excecute (ScriptContext context, Window window)
{
    window.Title = "DVH Plot";
    window.Content = CreatePlotView(context.PlanSetup);
}

private PlotView CreatePlotView(PlanSetup plan)
{
    return new PlotView();
}
If you’re using EclipsePlugInRunner, the code in the Execute method should go in the Run method. Also, because the Run method doesn’t have a context parameter, pass the planSetup variable directly to the CreatePlotView method.
Be sure to add using "OxyPlot.Wpf;" at the top of the Script.cs file, where the other using statements are. This will make the PlotView class available to use in the file. Visual Studio Community 2017 is very good at helping you add the necessary using statements as you code.
The code above sets the main window’s title to "DVH Plot" and assigns the window’s content to a new PlotView object, which is created in the CreatePlotView method. Eclipse will automatically show the window to the user. Because the PlotView object is empty, the window will have nothing inside (you’ll fix that soon).
The PlotView class represents the graphical area (or "view") of the plot. However, you don’t directly add the data to be drawn to the PlotView object. Instead, you create a PlotModel object first, fill it up with data and configure how it should look, and then assign it to the Model property of the PlotView object. Update the CreatePlotView method to create a PlotModel object:
private PlotView CreatePlotView(PlanSetup plan)
{
    return new PlotView {Model = CreatePlotModel(plan)};
}

private PlotModel CreatePlotModel(PlanSetup plan)
{
    return new PlotModel();
}
Using C#’s "object initialization" feature, the Model property can be assigned in the same line that creates the PlotView object. At the moment, the new PlotModel object is empty. Before you add any DVH curves to this model, however, you need to understand what a series is.
A series represents the set of data you want to plot, similar to the concept of a series in an Excel chart. A plot in OxyPlot is composed of one or more series, which may be of different types, such as line, scatter, or column. For this script, you’re going to use a line series for each DVH. Modify the CreatePlotModel method to create and add each DVH series to the PlotModel:
private PlotModel CreatePlotModel(PlanSetup plan)
{
    var model = new PlotModel();
    AddDvhs(model, plan);
    return model;
}

private void AddDvhs(PlotModel model, PlanSetup plan)
{
    var structures = GetDesiredStructures(plan);
    foreach (var structure in structures)
    {
        var dvh = CalculateDvh(plan, structure);
        var series = CreateDvhSeries(dvh);
        model.Series.Add(series);
    }
}
The AddDvhs method first obtains the desired structures. It then goes through each structure, calculates its DVH, creates a series for it, and finally adds the series to the PlotModel object. This method uses several helper methods to accomplish these tasks. It’s good programming practice to split up a complex method into smaller, more manageable methods. The first helper method is GetDesiredStructures:
private List <Structure> GetDesiredStructures(PlanSetup plan)
{
    var desiredStructureIds = new[] {"PTV", "LIVER"};
    var desiredStructures = new List<Structure>();
    foreach (var structureId in desiredStructureIds)
        desiredStructures.Add(FindStructure(structureId, plan));
    return desiredStructures;
}

private Structure FindStructure(string id, PlanSetup plan)
{
    return plan.StructureSet.Structures.First(s => s.Id == id);
}
First, the IDs of the structures are hard-coded and stored in an array. (In the next script, the user will be able to choose which DVHs to plot.) Then, an empty list of Structure objects is created. For each of the structure IDs in the array, the corresponding Structure object is obtained via the FindStructure method, and it is added to the list. Finally, the list is returned.
The FindStructure method uses LINQ to find the first Structure in the plan’s structure set whose Id property matches the given id parameter. LINQ stands for language-integrated query, and it is a C# feature that allows you to easily perform operations on collections, such as lists and arrays. These operations include searching, filtering, sorting, and grouping.
The next helper method, CalculateDvh, uses the GetDVHCumulativeData method of the PlanSetup class to calculate the given structure’s DVH in absolute units:
private DVHData CalculateDvh(PlanSetup plan, Structure structure)
{
    return plan.GetDVHCumulativeData(structure,
        DoseValuePresentation.Absolute,
        VolumePresentation.AbsoluteCm3, 0.01);
}
This method returns a DVHData object, which contains the DVH, and it is passed to the final helper method, CreateDvhSeries:
private Series CreateDvhSeries(DVHData dvh)
{
    var series = new LineSeries();
    var points = CreateDataPoints(dvh);
    series.Points.AddRange(points);
    return series;
}

private List<DataPoint> CreateDataPoints(DVHData dvh)
{
    var points = new List<DataPoint>();
    foreach (var dvhPoint in dvh.CurveData)
    {
        var point = CreateDataPoint(dvhPoint);
        points.Add(point);
    }
    return points;
}

private DataPoint CreateDataPoint(DVHPoint dvhPoint)
{
    return new DataPoint(dvhPoint.DoseValue.Dose, dvhPoint.Volume);
}
This method starts by creating the line series for the DVH. It then creates the DVH points using CreateDataPoint, described shortly. The created points are then added to the series, and the entire series is returned. Notice that the Points property of the series is of type List<DataPoint>, so you can use its AddRange method to add all the points at once.
In the CreateDataPoints method, each point in the DVH curve, provided by CurveData, is converted to an OxyPlot DataPoint object. The reason you need this conversion is that OxyPlot only understands DataPoint objects, not DVHPoint objects, which is what CurveData contains.
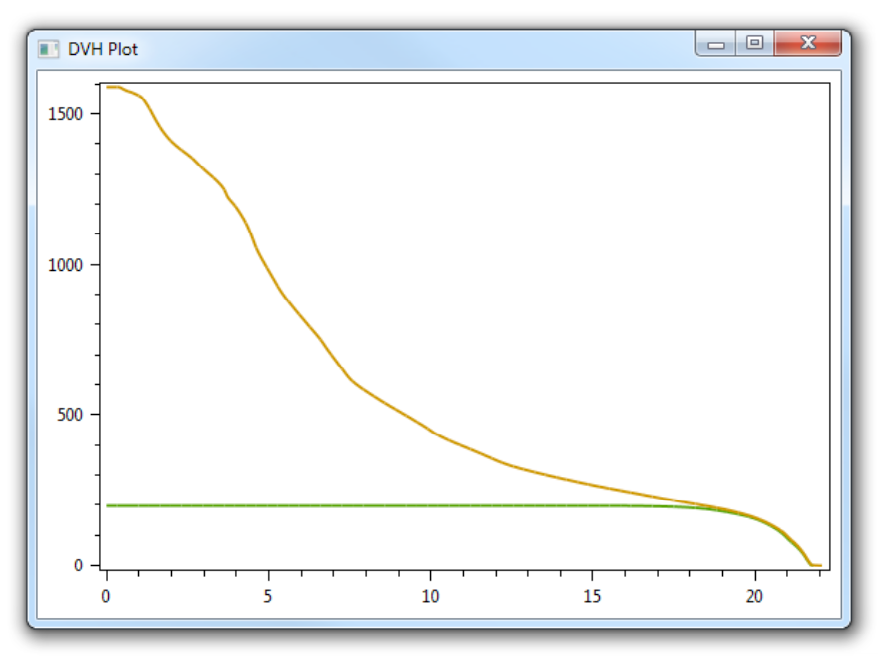
You are now almost ready to run this script in Eclipse (or Visual Studio). First, though, make sure to change the desired structure IDs to something you know your test patient has in its plan. The code you’ve written so far does not do any error checking or exception handling, so if any structure is not found, it’ll crash. Now, you should be able to run the script and see a window like this (of course, the exact DVH curves will be different):
If you’re like me, you’d immediately notice the plot is missing something every plot should have: axis titles. Modify the CreatePlotModel method to add custom axes:
private PlotModel CreatePlotModel(PlanSetup plan)
{
    var model = new PlotModel();
    AddAxes(model);
    AddDvhs(model, plan);
    return model;
}

private void AddAxes(PlotModel model)
{
    // Add x- axis
    model.Axes.Add(new LinearAxis
    {
        Title = "Dose [Gy]",
        Position = AxisPosition.Bottom
    });

    // Add y- axis
    model.Axes.Add(new LinearAxis
    {
        Title = "Volume [cc]",
        Position = AxisPosition.Left
    });
}
The AddAxes method first adds the x-axis with the "Dose [Gy]" title, and then the y-axis with the "Volume [cc]" title. The Position property specifies where to put each of the axes. If you run the script now, it should look like the screenshot at the start of this post.
Comments